- HostileCharts
- Posts
- Housing Holds the Key
Housing Holds the Key
I ran through a mountain of charts on Thompson Two Cents Live yesterday.
But if you want to understand the consumer right now, you only need one… housing.
When you’re talking about consumer spending, you’re really talking about feelings.
Confidence. Stability. Momentum.
I won’t pretend to be an economist, but I do understand how to read charts and how the U.S. actually does business.
The U.S. economy runs on consumer spend.
That’s you and me swiping our cards on stuff we need… and stuff we don’t need.
Everyone is going to buy toilet paper. That’s staples.
But it’s discretionary spend that fuels growth.
Vacations, furniture, clothes, tech, eating out… the things you buy when you feel like your life is on stable ground.
It’s why I keep a close eye on the Consumer Discretionary vs. Consumer Staples Chart.
And one of the biggest drivers of that “I can spend” feeling is housing.
Housing is the backbone.
When people buy a home, they’re not just buying drywall and a roof.
They’re signaling confidence in their job, their location, and their ability to provide in the future.
Sure, homeownership may not carry the same “American Dream” mystique it once had, but it’s still a major marker of stability.
This is where the K-shape economy shows itself.
The top branch of the “K” spends through anything.
Markets up? They’re spending.
Markets down? Still spending.
But the majority of Americans don’t spend based on markets.
They spend based on how secure they feel.
And nothing drives that emotional security (or fragility) like the housing market.
Because when you buy a home, you don’t just sign a mortgage.
You unleash a wave of discretionary spending into the economy:
Most new homeowners drop $10,000–$20,000 in the first 3–6 months after closing.
Many economist have been talking about the K-shaped economy all year.
The bottom half (housing, retail, labor sensitivity) has been showing stress for months.
And, like clockwork, those early cracks in housing became a leading indicator for weakness creeping into the upper branch of the K—the part of the market everyone thinks is “untouchable.”
This is exactly why the economy ≠ the market.
The top 20 megacap stocks can stay strong long after the average household starts feeling pressure and they make up the majority of the stock market but not the majority of consumer confidence.
Their weight allows the S&P 500 to ignore the bottom half of the K for a while… until it can’t.
And this year we saw it: housing ($ITB/$XHB) started rolling over, then equal-weight retail followed, then consumer discretionary, and now failed breakouts are becoming the rule, not the exception.
The message of the economy is finally showing up in the market.
As stocks got whacked this week and several “lines in the sand” were taken out, the burden of proof - at least in the short term - has shifted to the bulls.
But there’s a twist.
Housing actually showed strength in the middle of the turmoil this week.
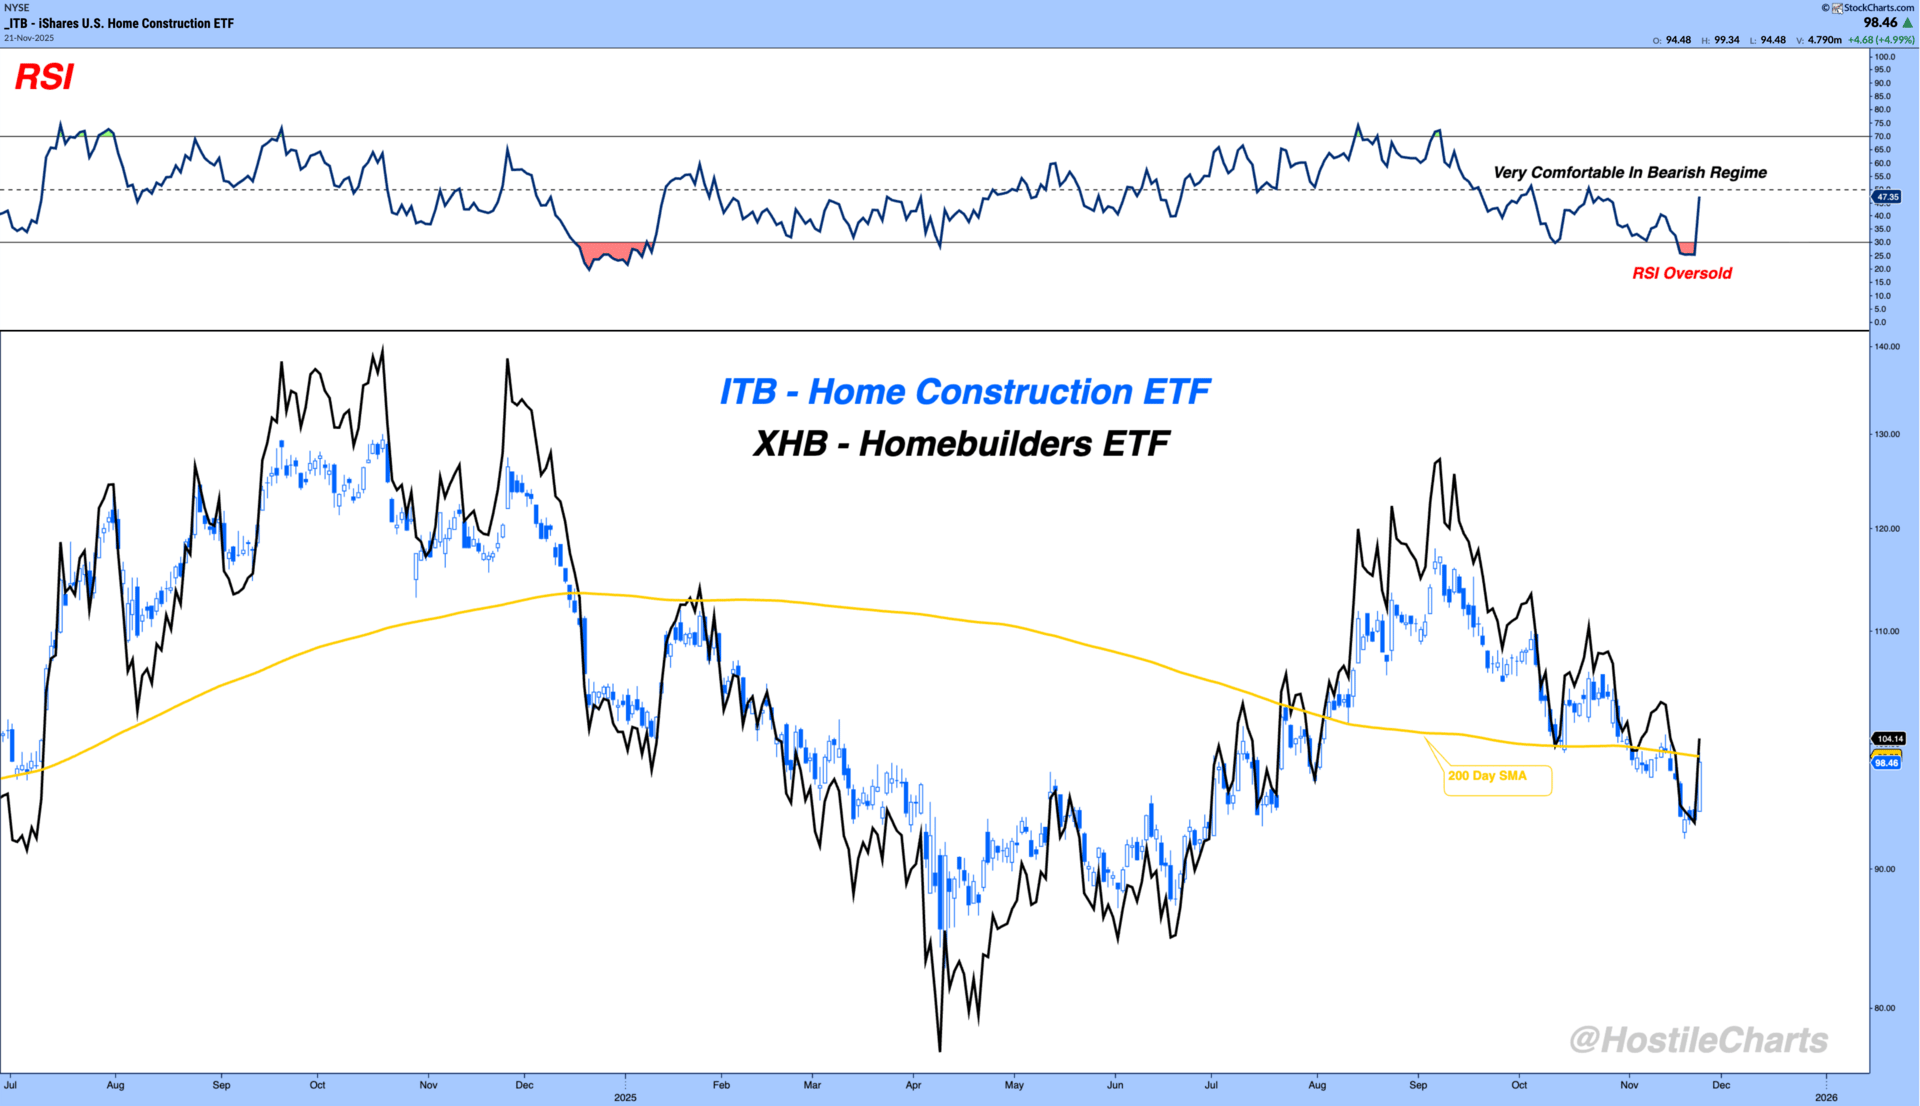
Reclaim the 200 Day and Follow Through Would Be Huge
A shining light in a messy tape.
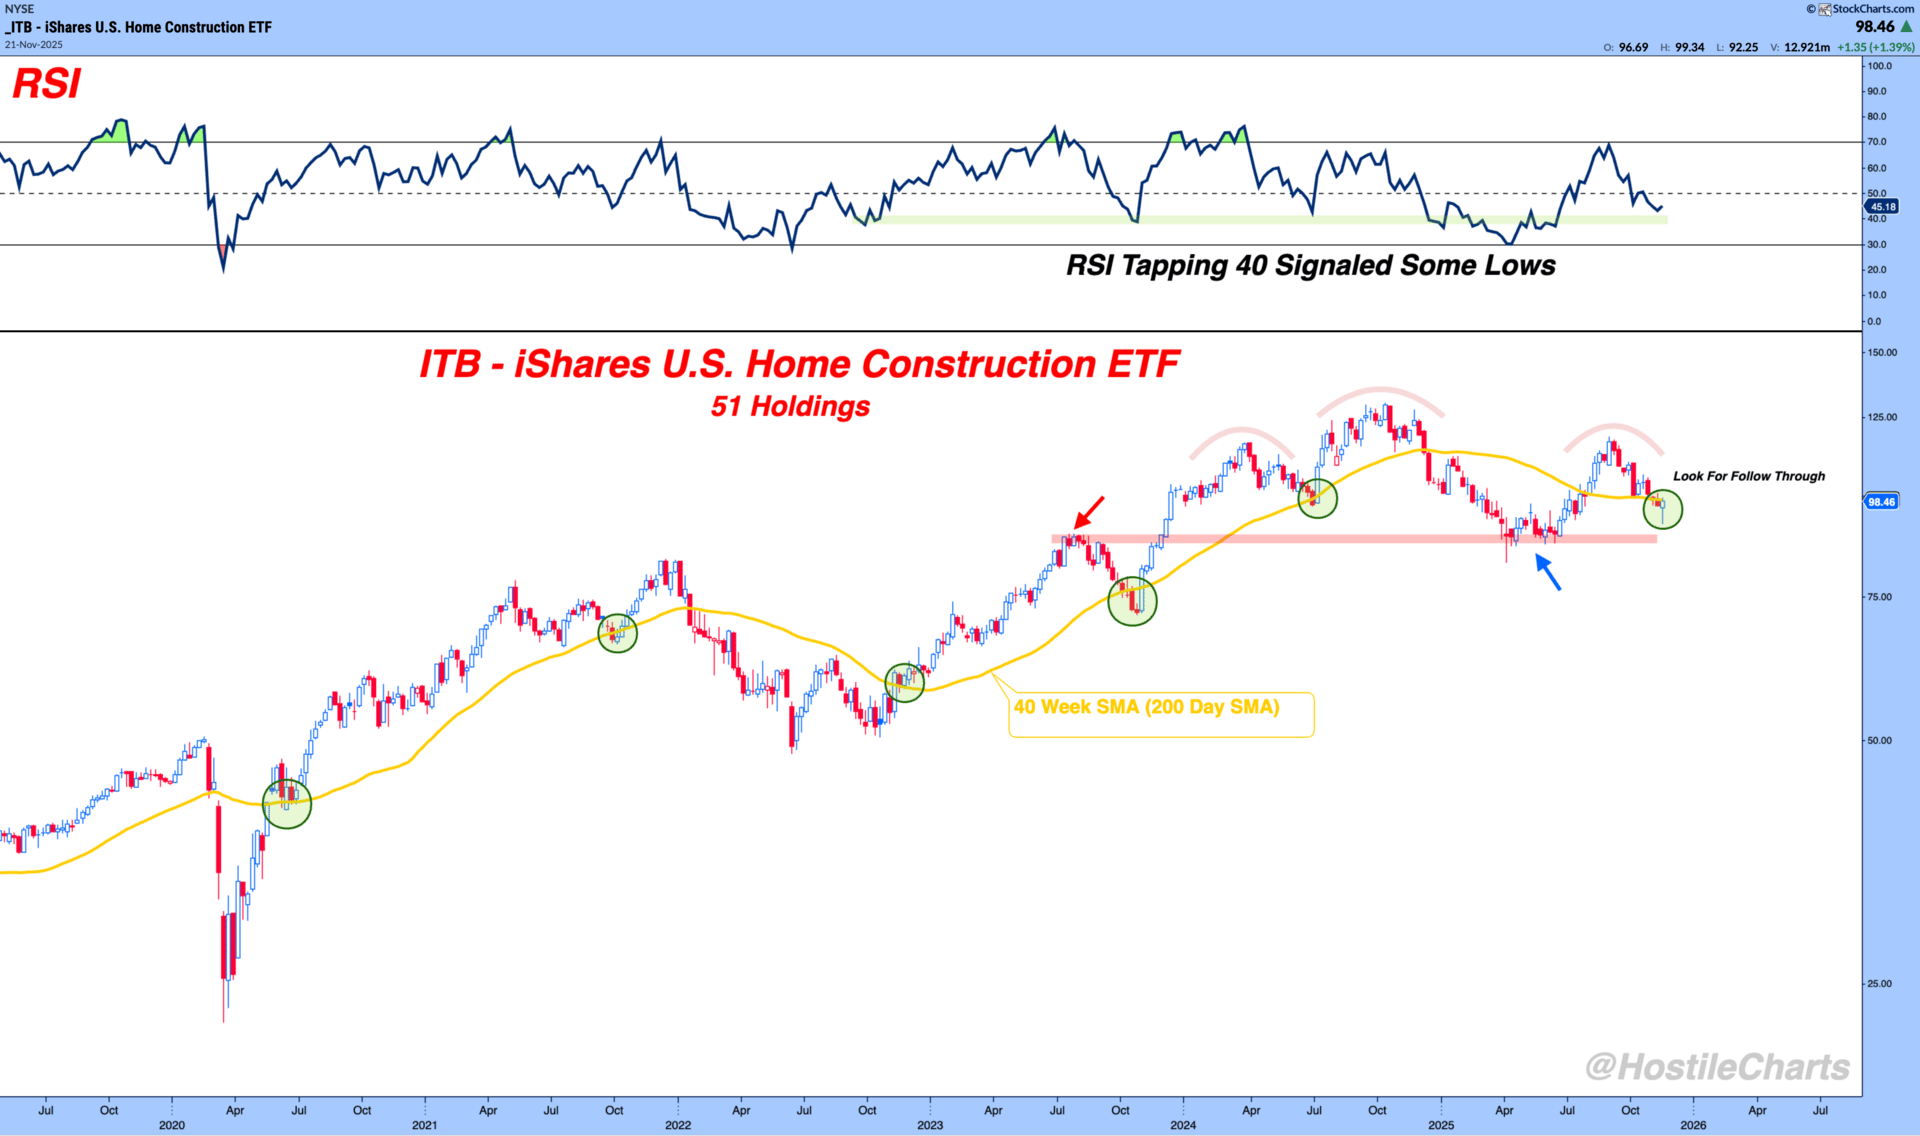
Housing Bottom Would Be A Big Tell
If we get follow-through here, it could be the first sign that we’re closer to the end of this contraction than the beginning.
If this is the bottom, we’ll know soon enough.
My Weekly Show - Thompson’s Two Cents
The Ugly, The Messy, The Saviors
Getting Great Feedback on this one already.
🚀 Throw it on 1.5x speed and let it rip.
👍 Give it a like. It’s the easiest way to show me some love.
The Sunday Stalk List | Ep. 24
If you want clean charts, clear setups, and tactical insights — this one’s for you.
It hits inboxes every Sunday so you know exactly what to keep an eye on for the week ahead.
Cheers,
Larry Thompson, CMT CPA